George Floyd and Breonna Taylor’s murders were clarion calls for Dayton Schroeter, AIA, and Julian Arrington at SmithGroup, and their travelling exhibit, “Society’s Cage,” was their response to three related questions: what is the value of Black life, what is the nature of power in this country, and what is the relationship of Black people to power structures in our country? The experience of visiting Society’s Cage centers on entering a 15’x15’ cube comprised of steel rods of varying lengths suspended within a series of rods that form a four-sided curtain. Visitors don’t move through the curtain so much as they contend with it. Our view in, out, or through the cube is fractured, striated, and ultimately governed by an unremitting and unforgiving structure. The metaphor is obvious, and that’s the point. Schroeter and Arrington wanted visitors to its first installment on the National Mall last summer to visualize power and understand how it contorts vision, body, and movement.
“A lot of things in American society have gone unsaid and there is a lot of pretending — there is this false impression that if we don’t bring something up it doesn’t exist,” says Arrington. “We wanted to shed light on these hidden truths so that they could no longer go ignored, and create opportunities for healing and reconciliation.”
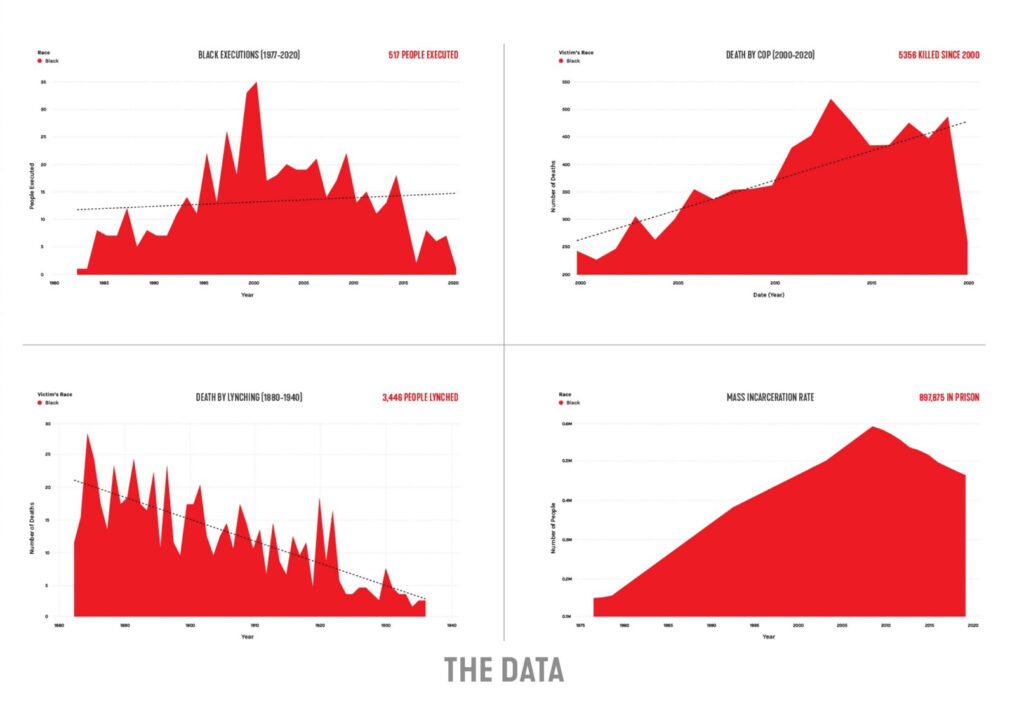
Visualizing power for Schroetter and Arrington is about visualizing its impact. The parti is a simple cube in the landscape, but in section, the rods represent the data of four bar graphs: Black Americans executed each year since 1977, Black Americans killed by police each year since 2000, Black Americans lynched between 1880 and 1940, and Blacks incarcerated each year since 1975. The peaks of the four charts create a contour map on the ceiling within the four walls of the cube. One in four rods used throughout Society’s Cage touches the ground, representing the statistical probability of being imprisoned as a Black American.

“The architectural language had to be capable of communicating the historic data and allow for a safe, COVID-19-resistant, open-air environment,” says Schroetter. “We ultimately chose steel pipes because they have a graphic quality capable of expressing the historic line graphs. Part of the power of Society’s Cage is that the data allows the visitor to experience history spatially and emotionally.”
SmithGroup estimates several thousand people visited Society’s Cage while it was installed on the National Mall for a 16-day stretch last August and again in Baltimore for 10 days in October. The firm is in conversation with several hosts, COVID notwithstanding, for its next location.
“Society’s Cage would be a powerful installation to have in place in Tulsa, for the centennial of the Tulsa Race massacre, but it could also speak well to European port cities like Liverpool that grew extremely wealthy from the transatlantic slave trade or Elmina, Ghana, with the infamous ‘door of no return,’ says Schroetter.
While evaluating the next location for Society’s Cage, Arrington and Schroetter have begun thinking about an expanded visitor experience. “We do think there is potential to grow [this] exhibit,” says Arrington. “Because of the scale of the installation, there is a lot of data that we couldn’t include. An expanded exhibit could assist in providing additional canvases for more information.”
Learn more about Society’s Cage and an augmented reality simulation at smithgroup.com.
About the Author
William Richards is a writer and editorial consultant based in Washington, D.C. From 2007 to 2011, he was the Editor-in-Chief of Inform Magazine.
